

Creating a current readings table
- Go to your configurable dashboard page.
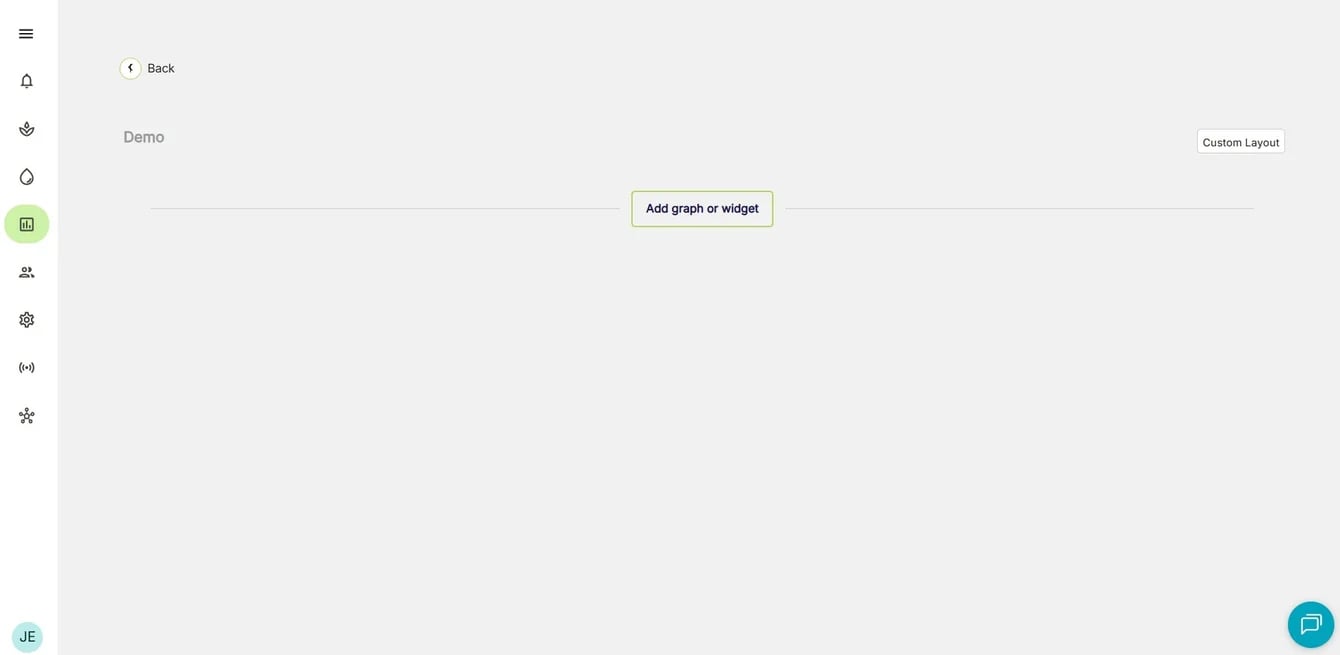
- Click Add graph or widget at the bottom of the page.
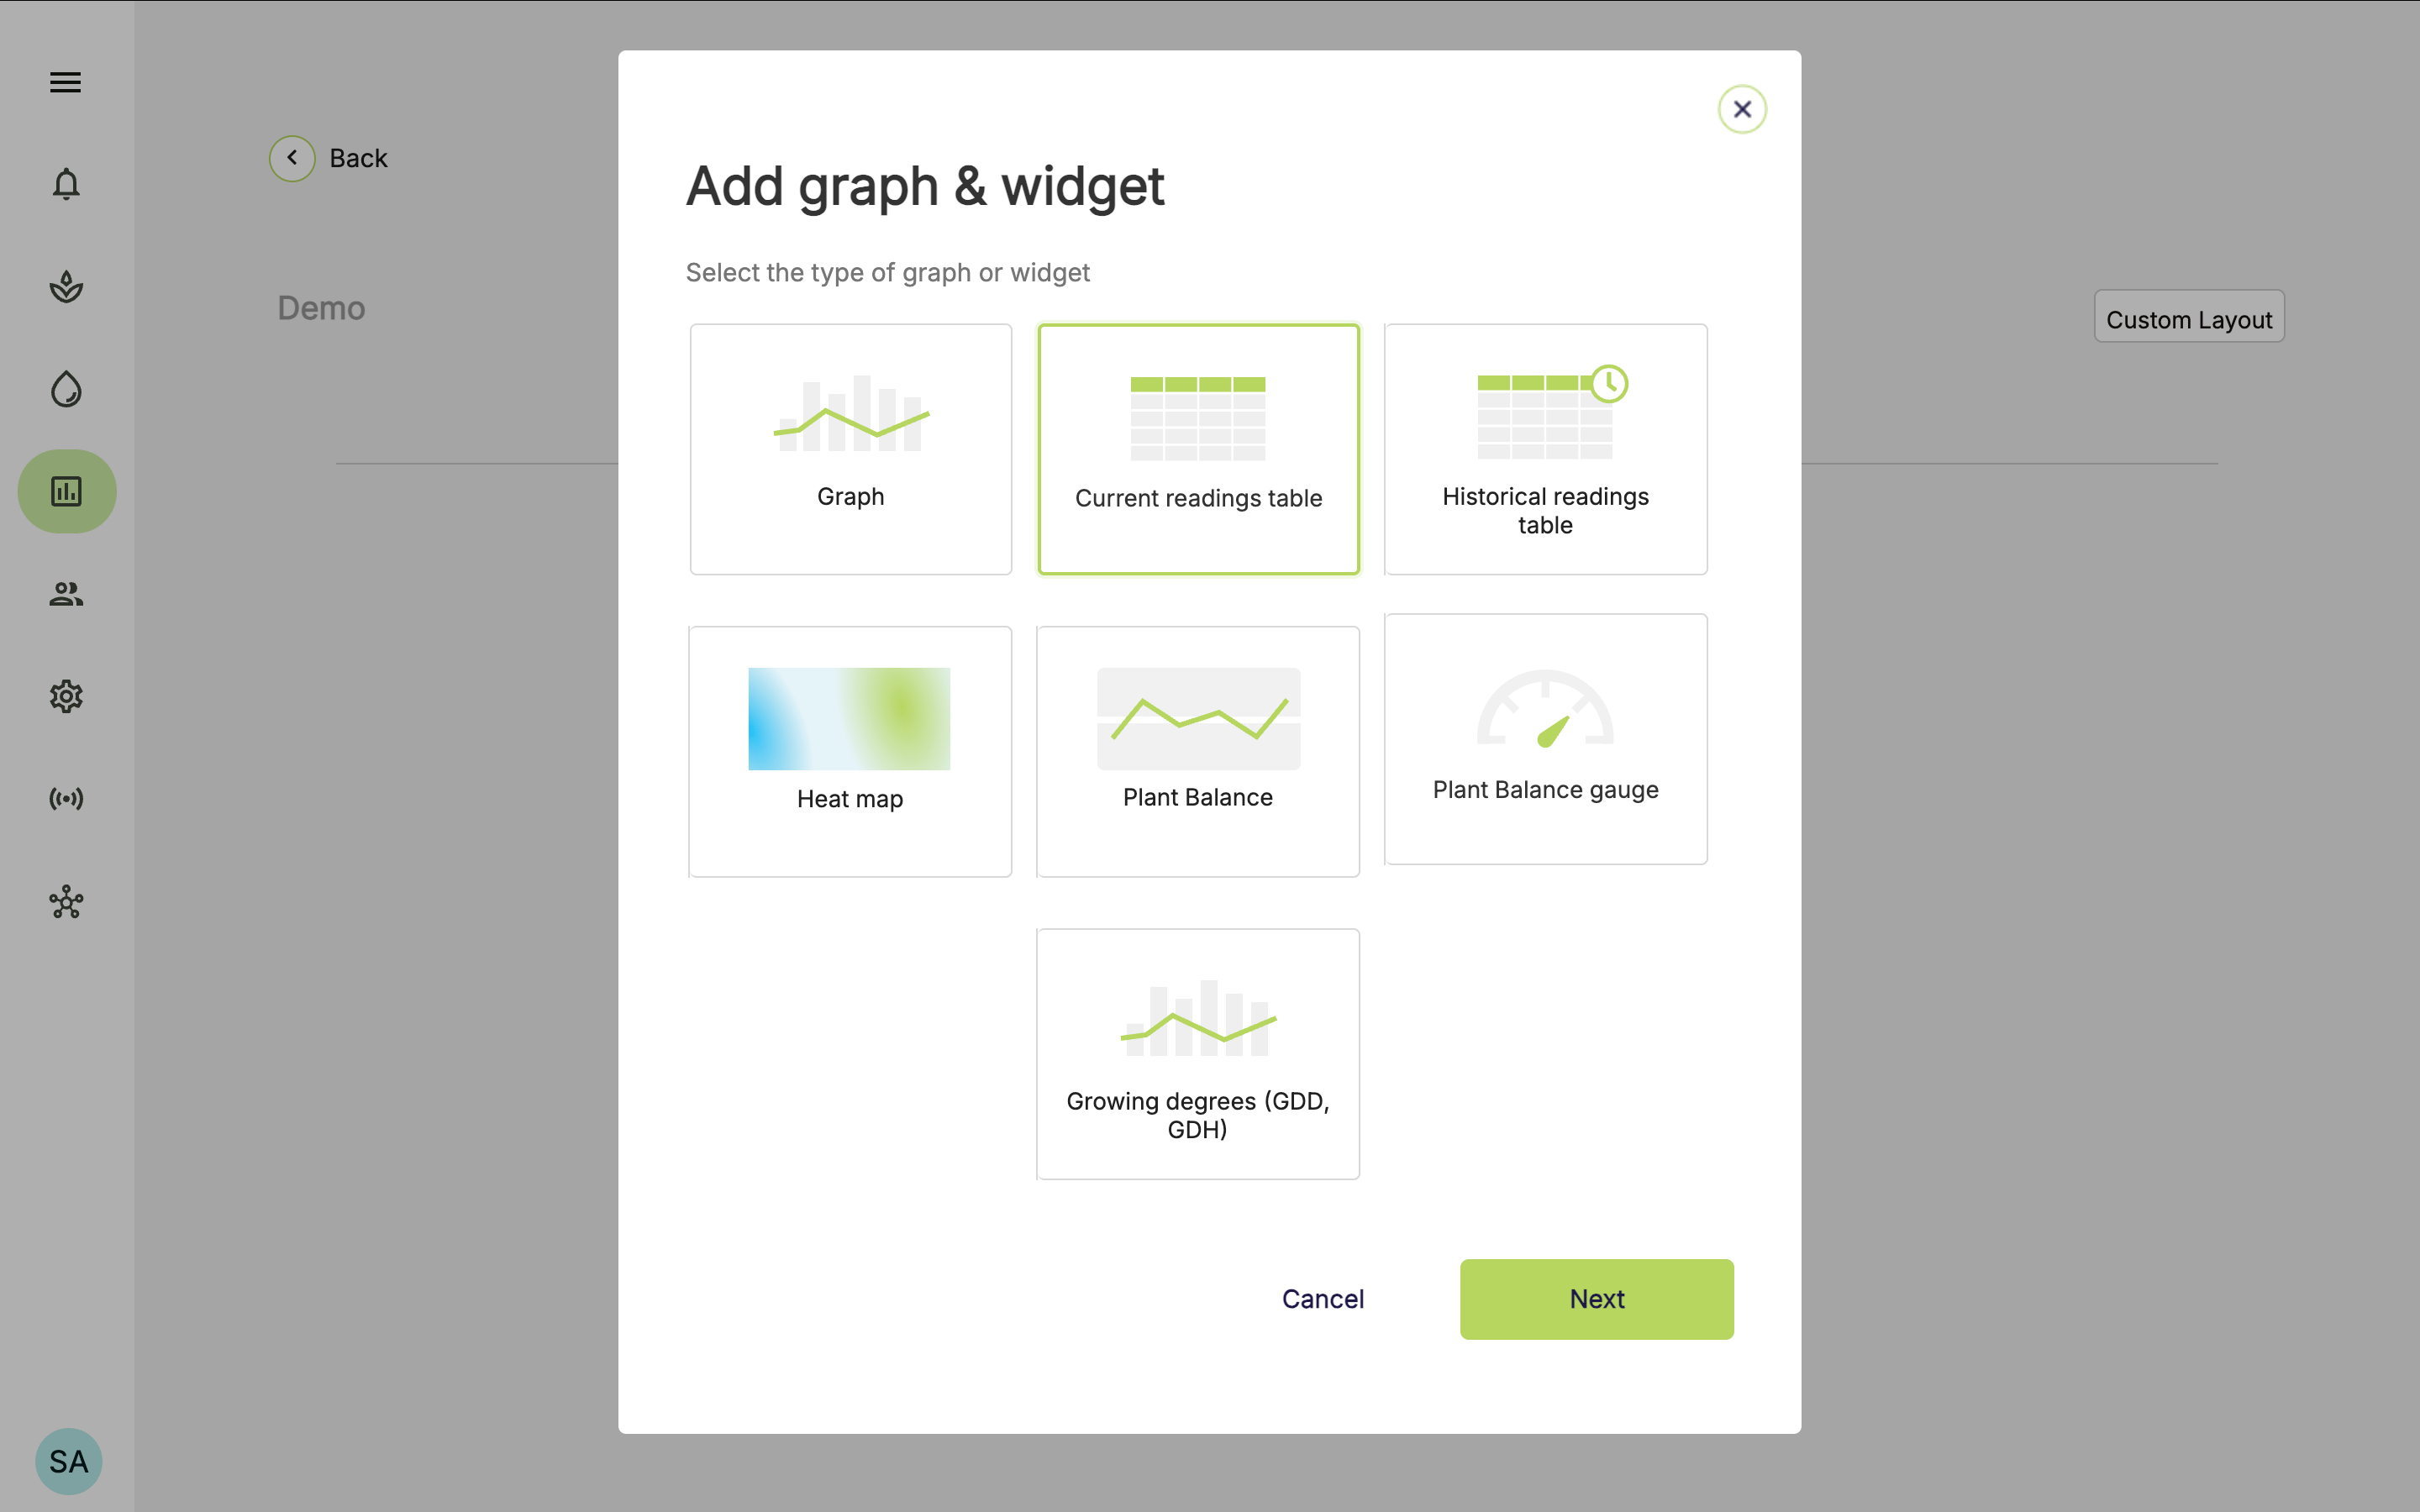
- You will be prompted to select the type of graph or widget you want. Select Current readings table and then click Next.
- You will then be asked to give the table a name.
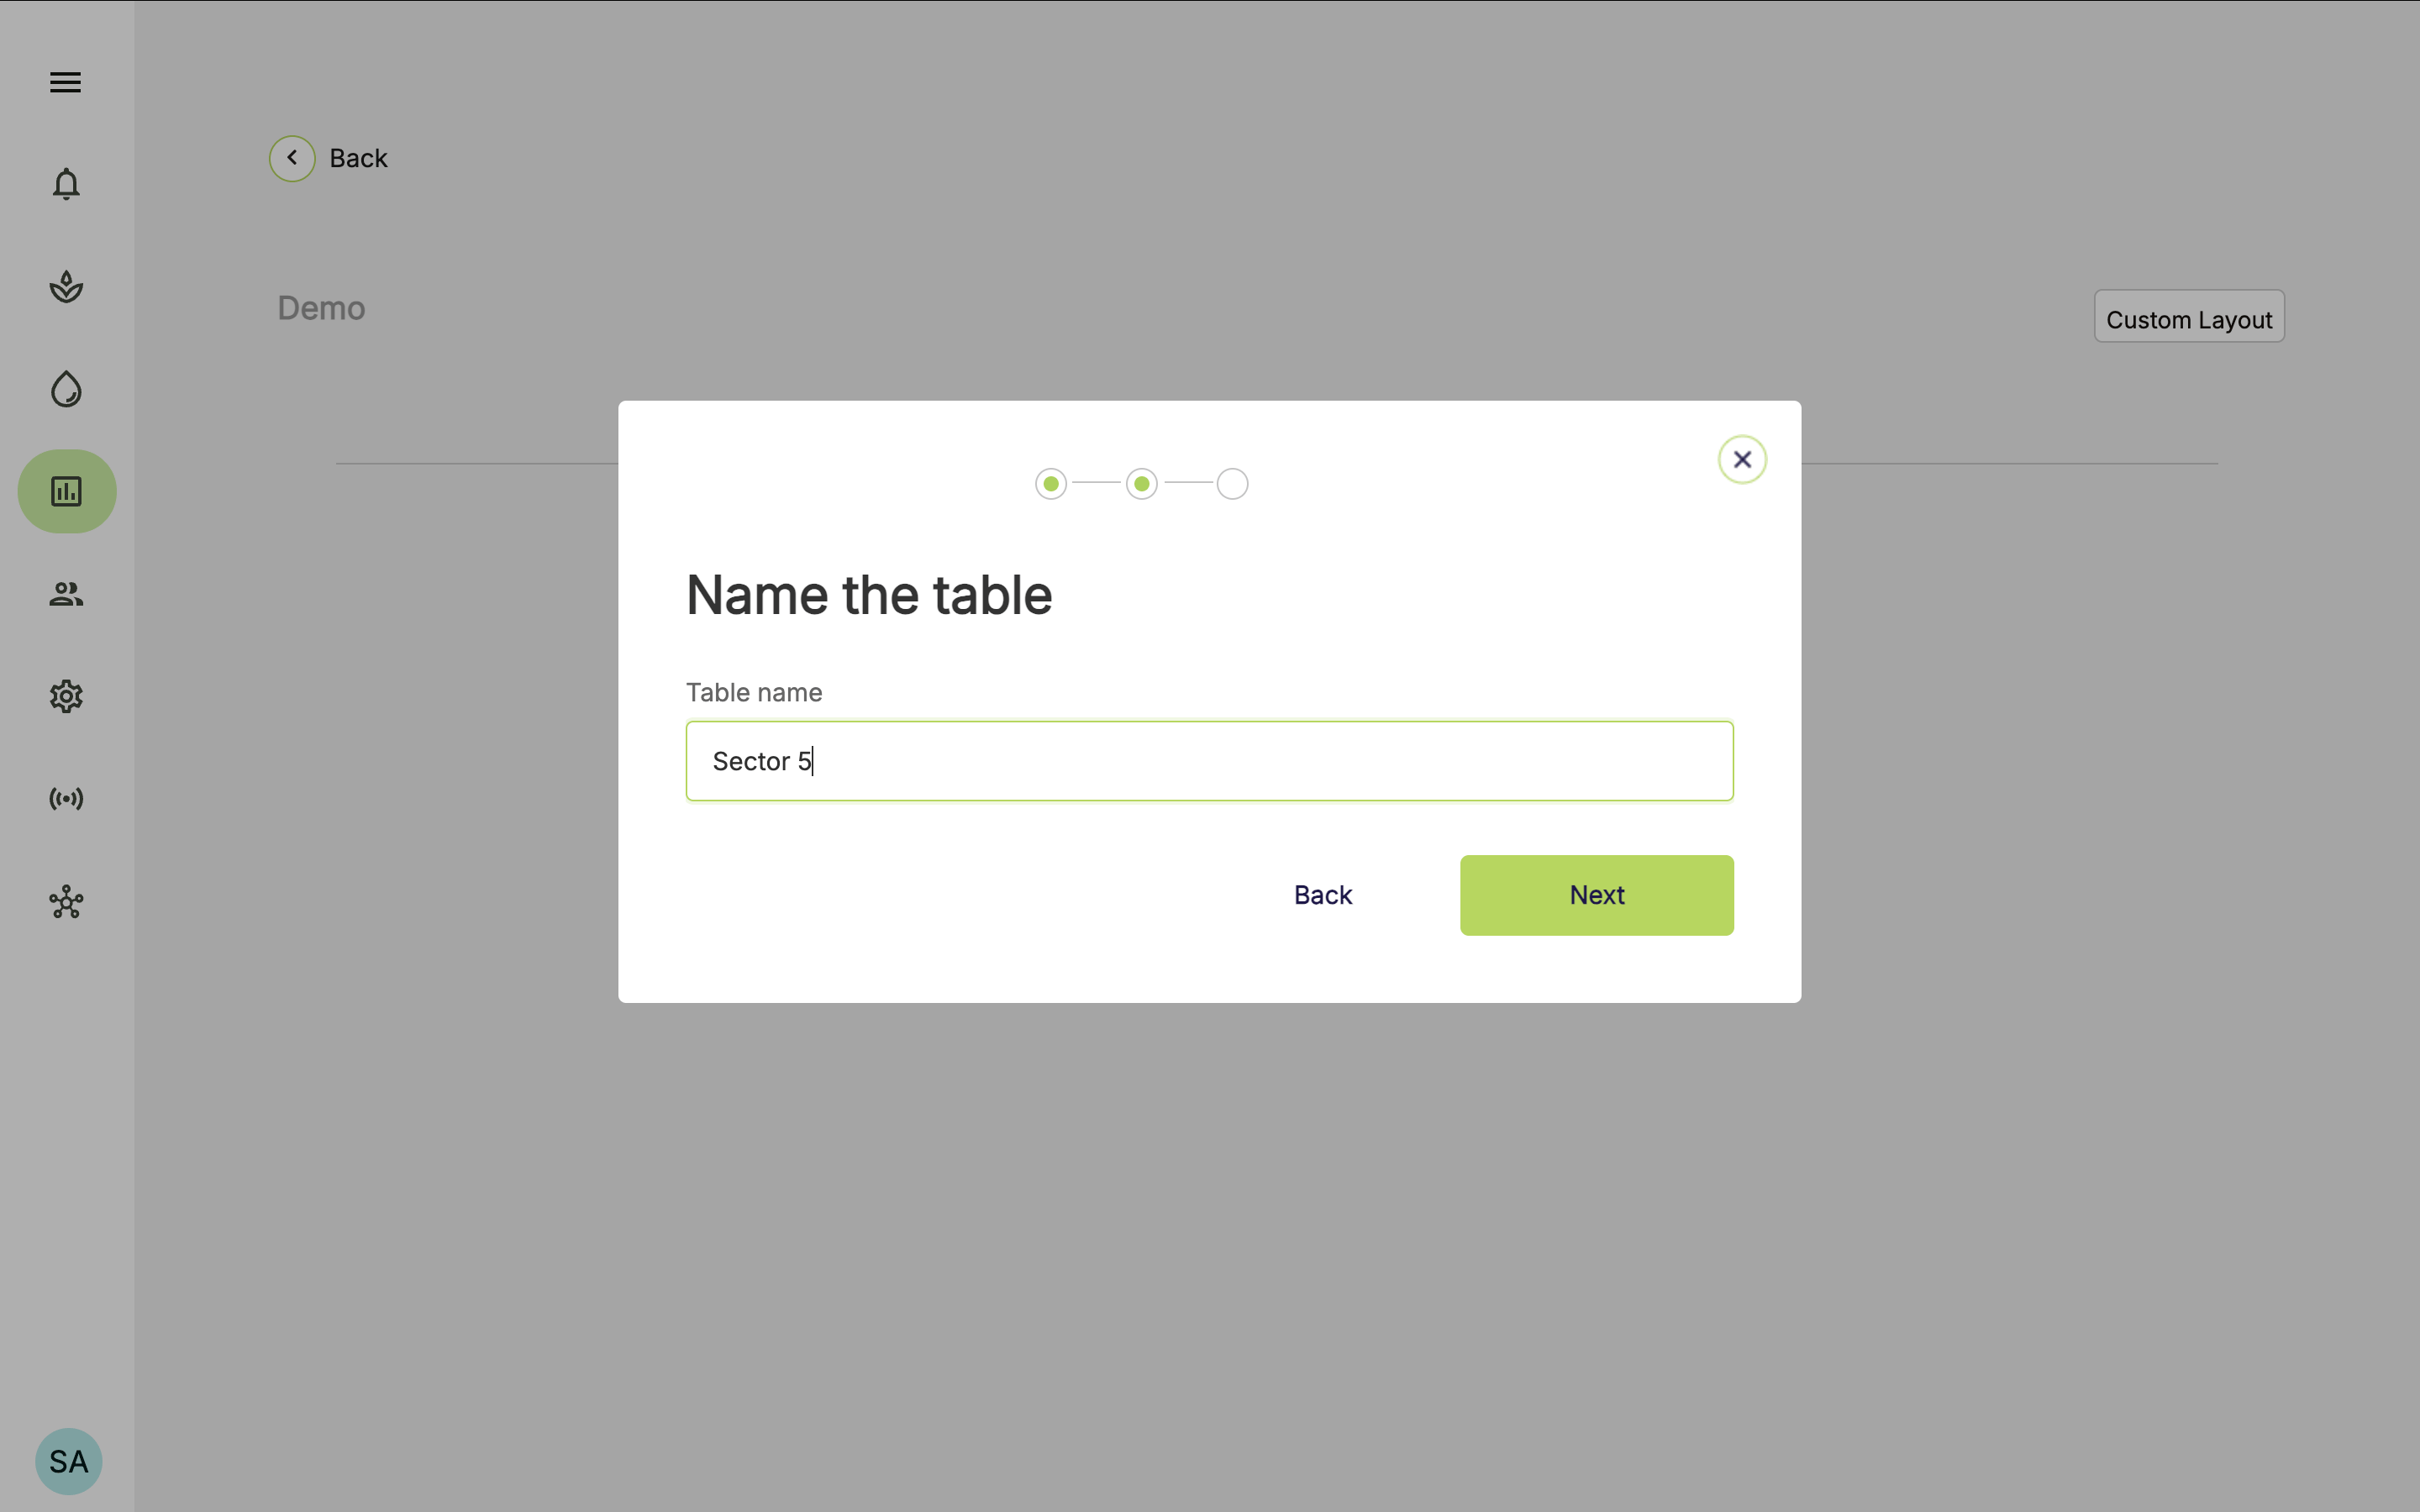
You can add any number of tables to a single dashboard.
Adding sensors to a Current readings table
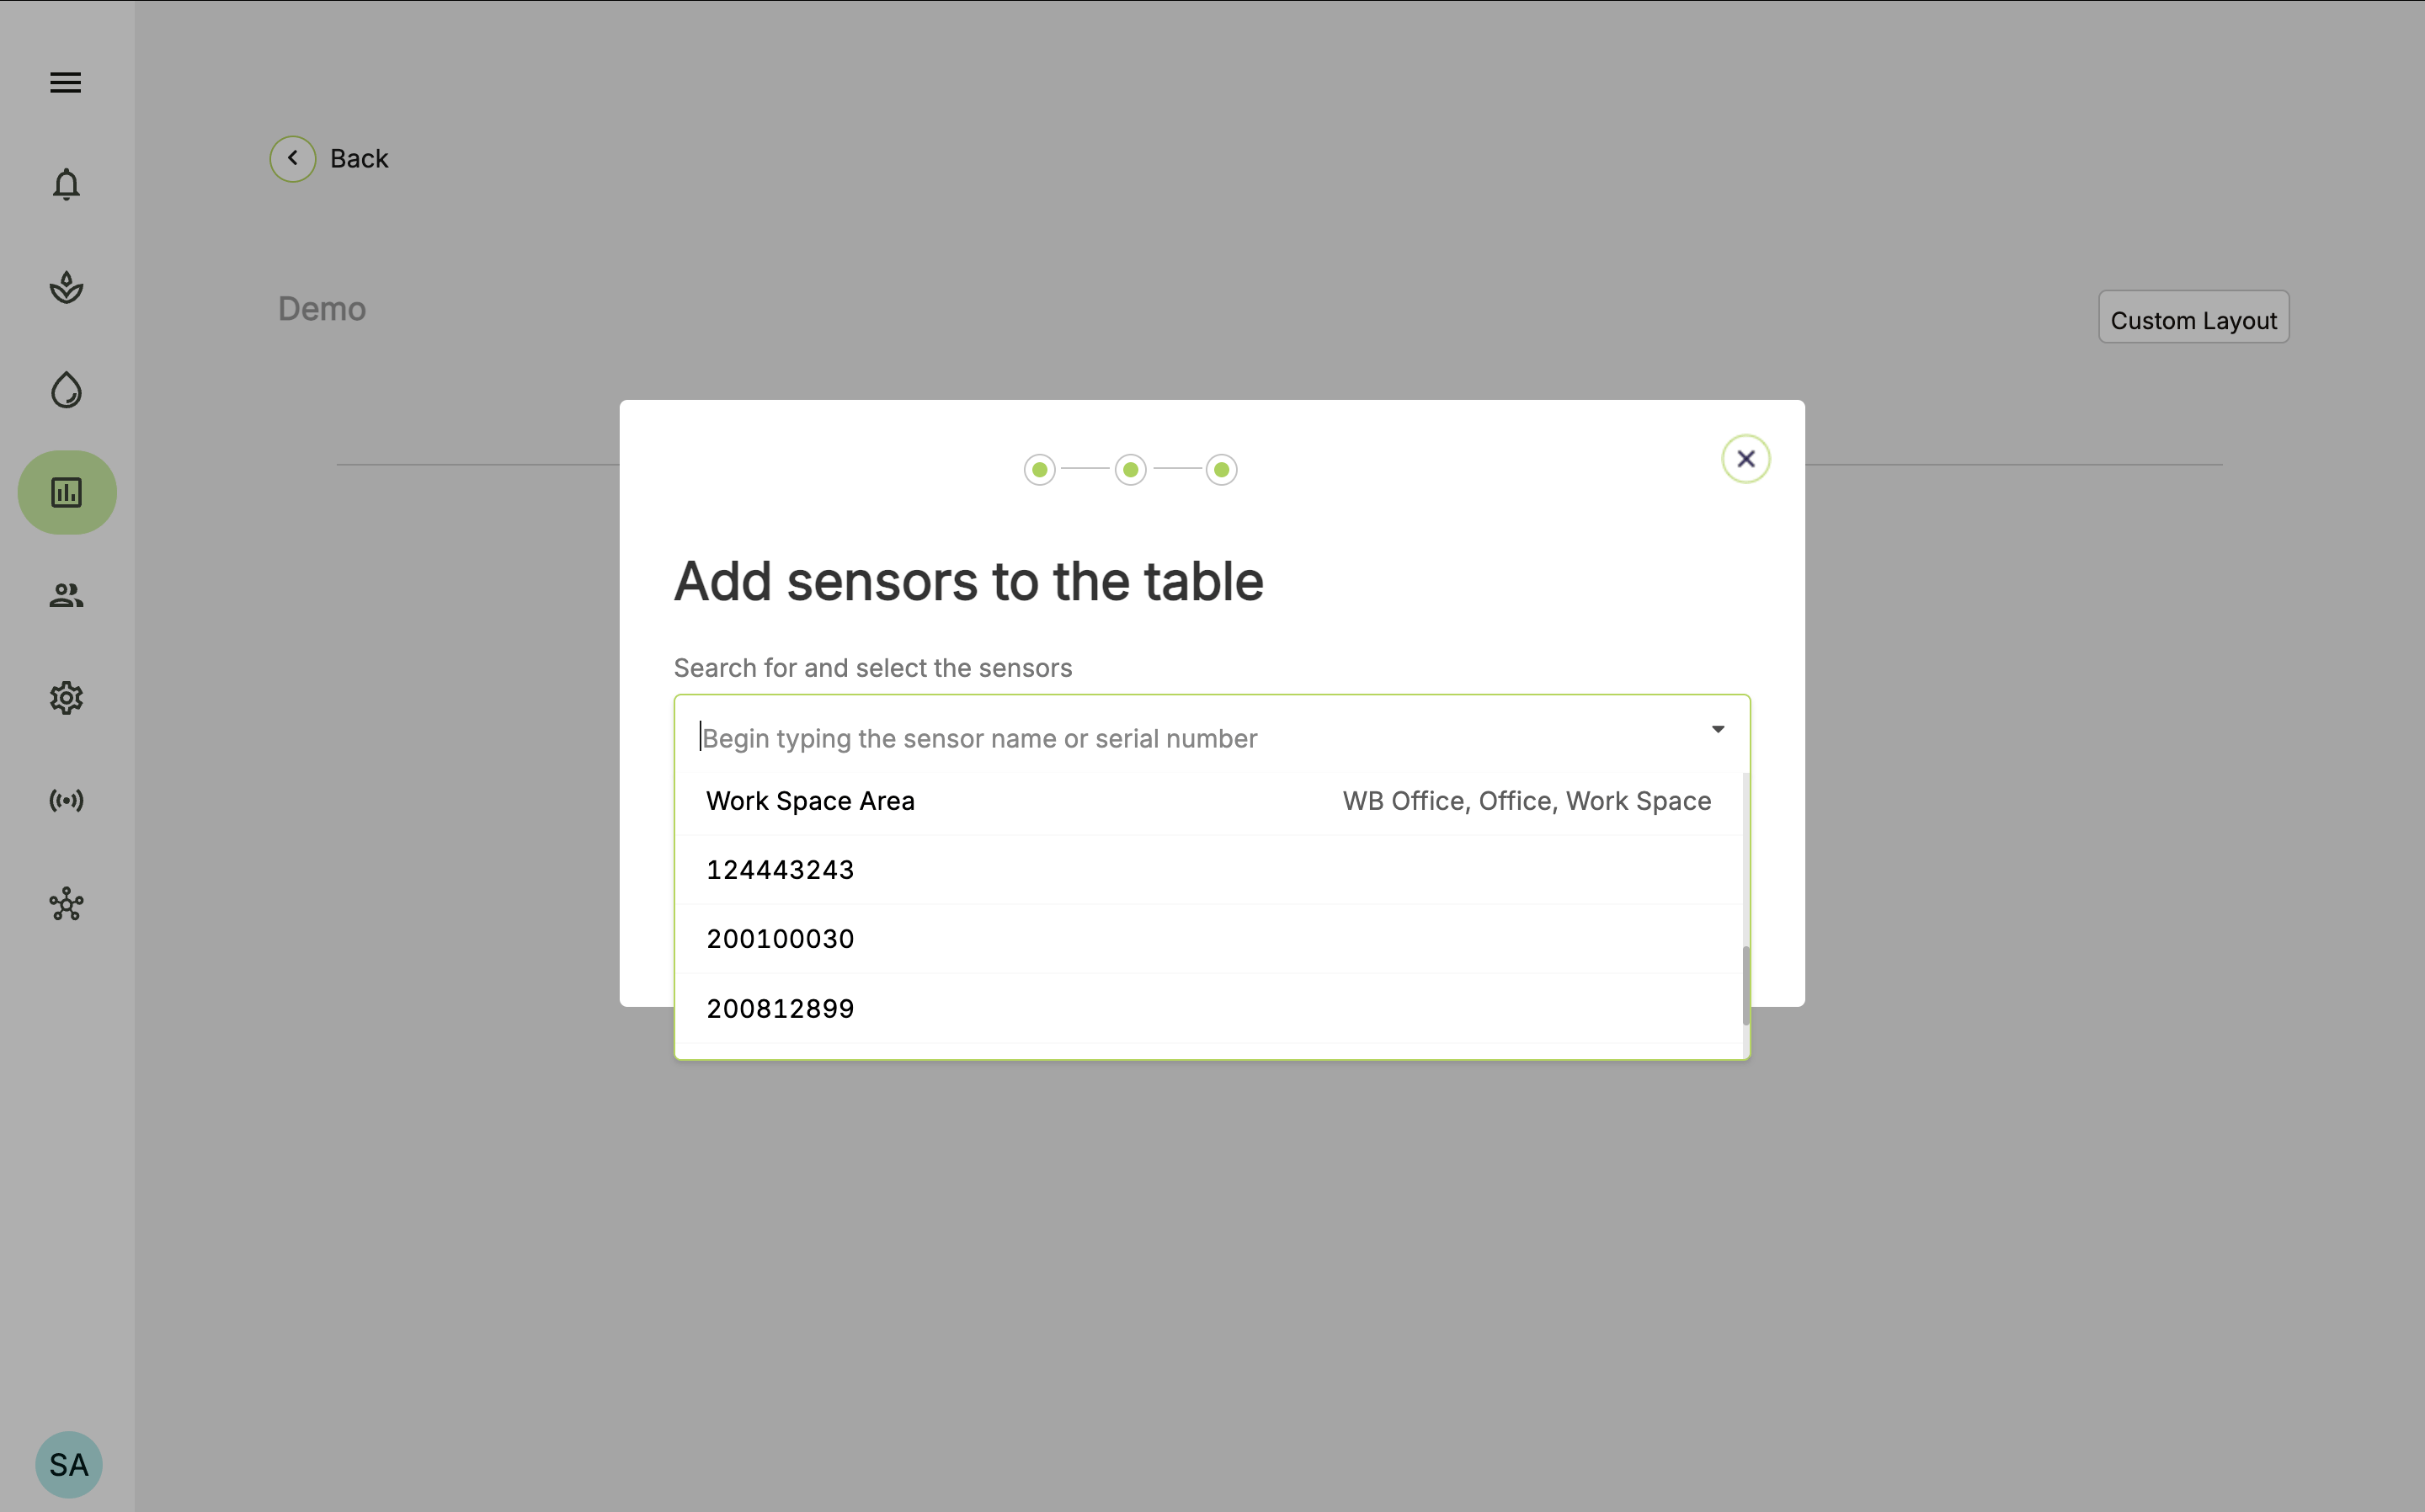
- Select the sensors you want to include in the table. You can search for the sensor name or select it from the drop-down list.
- Choose as many sensors as you want.
- Select Done.
What readings are available in a current readings table?
The current readings table shows an up-to-date snapshot of your sensors. If your sensors have not reported in the last 5 minutes, the table will show no readings. If your sensors are reporting, the table can show the following readings:- Air Temperature
- Relative Humidity
- Barometric Pressure
- CO2
- PAR (Photosynthetically Available Radiation)
- RAD (Solar Radiation)
- Plant Temperature
- Estimated VPD (calculated using Air Temperature and Relative Humidity)
- Actual VPD (calculated using Plant Temperature and Relative Humidity)
- Dew Point
- Moisture (Volumetric Water Content)
Creating a historical readings table
- Go to your configurable dashboard page.
- Click Add graph or widget at the bottom of the page.
- You will be prompted to select the type of graph or widget you want. Select Historical readings table and then click Next.
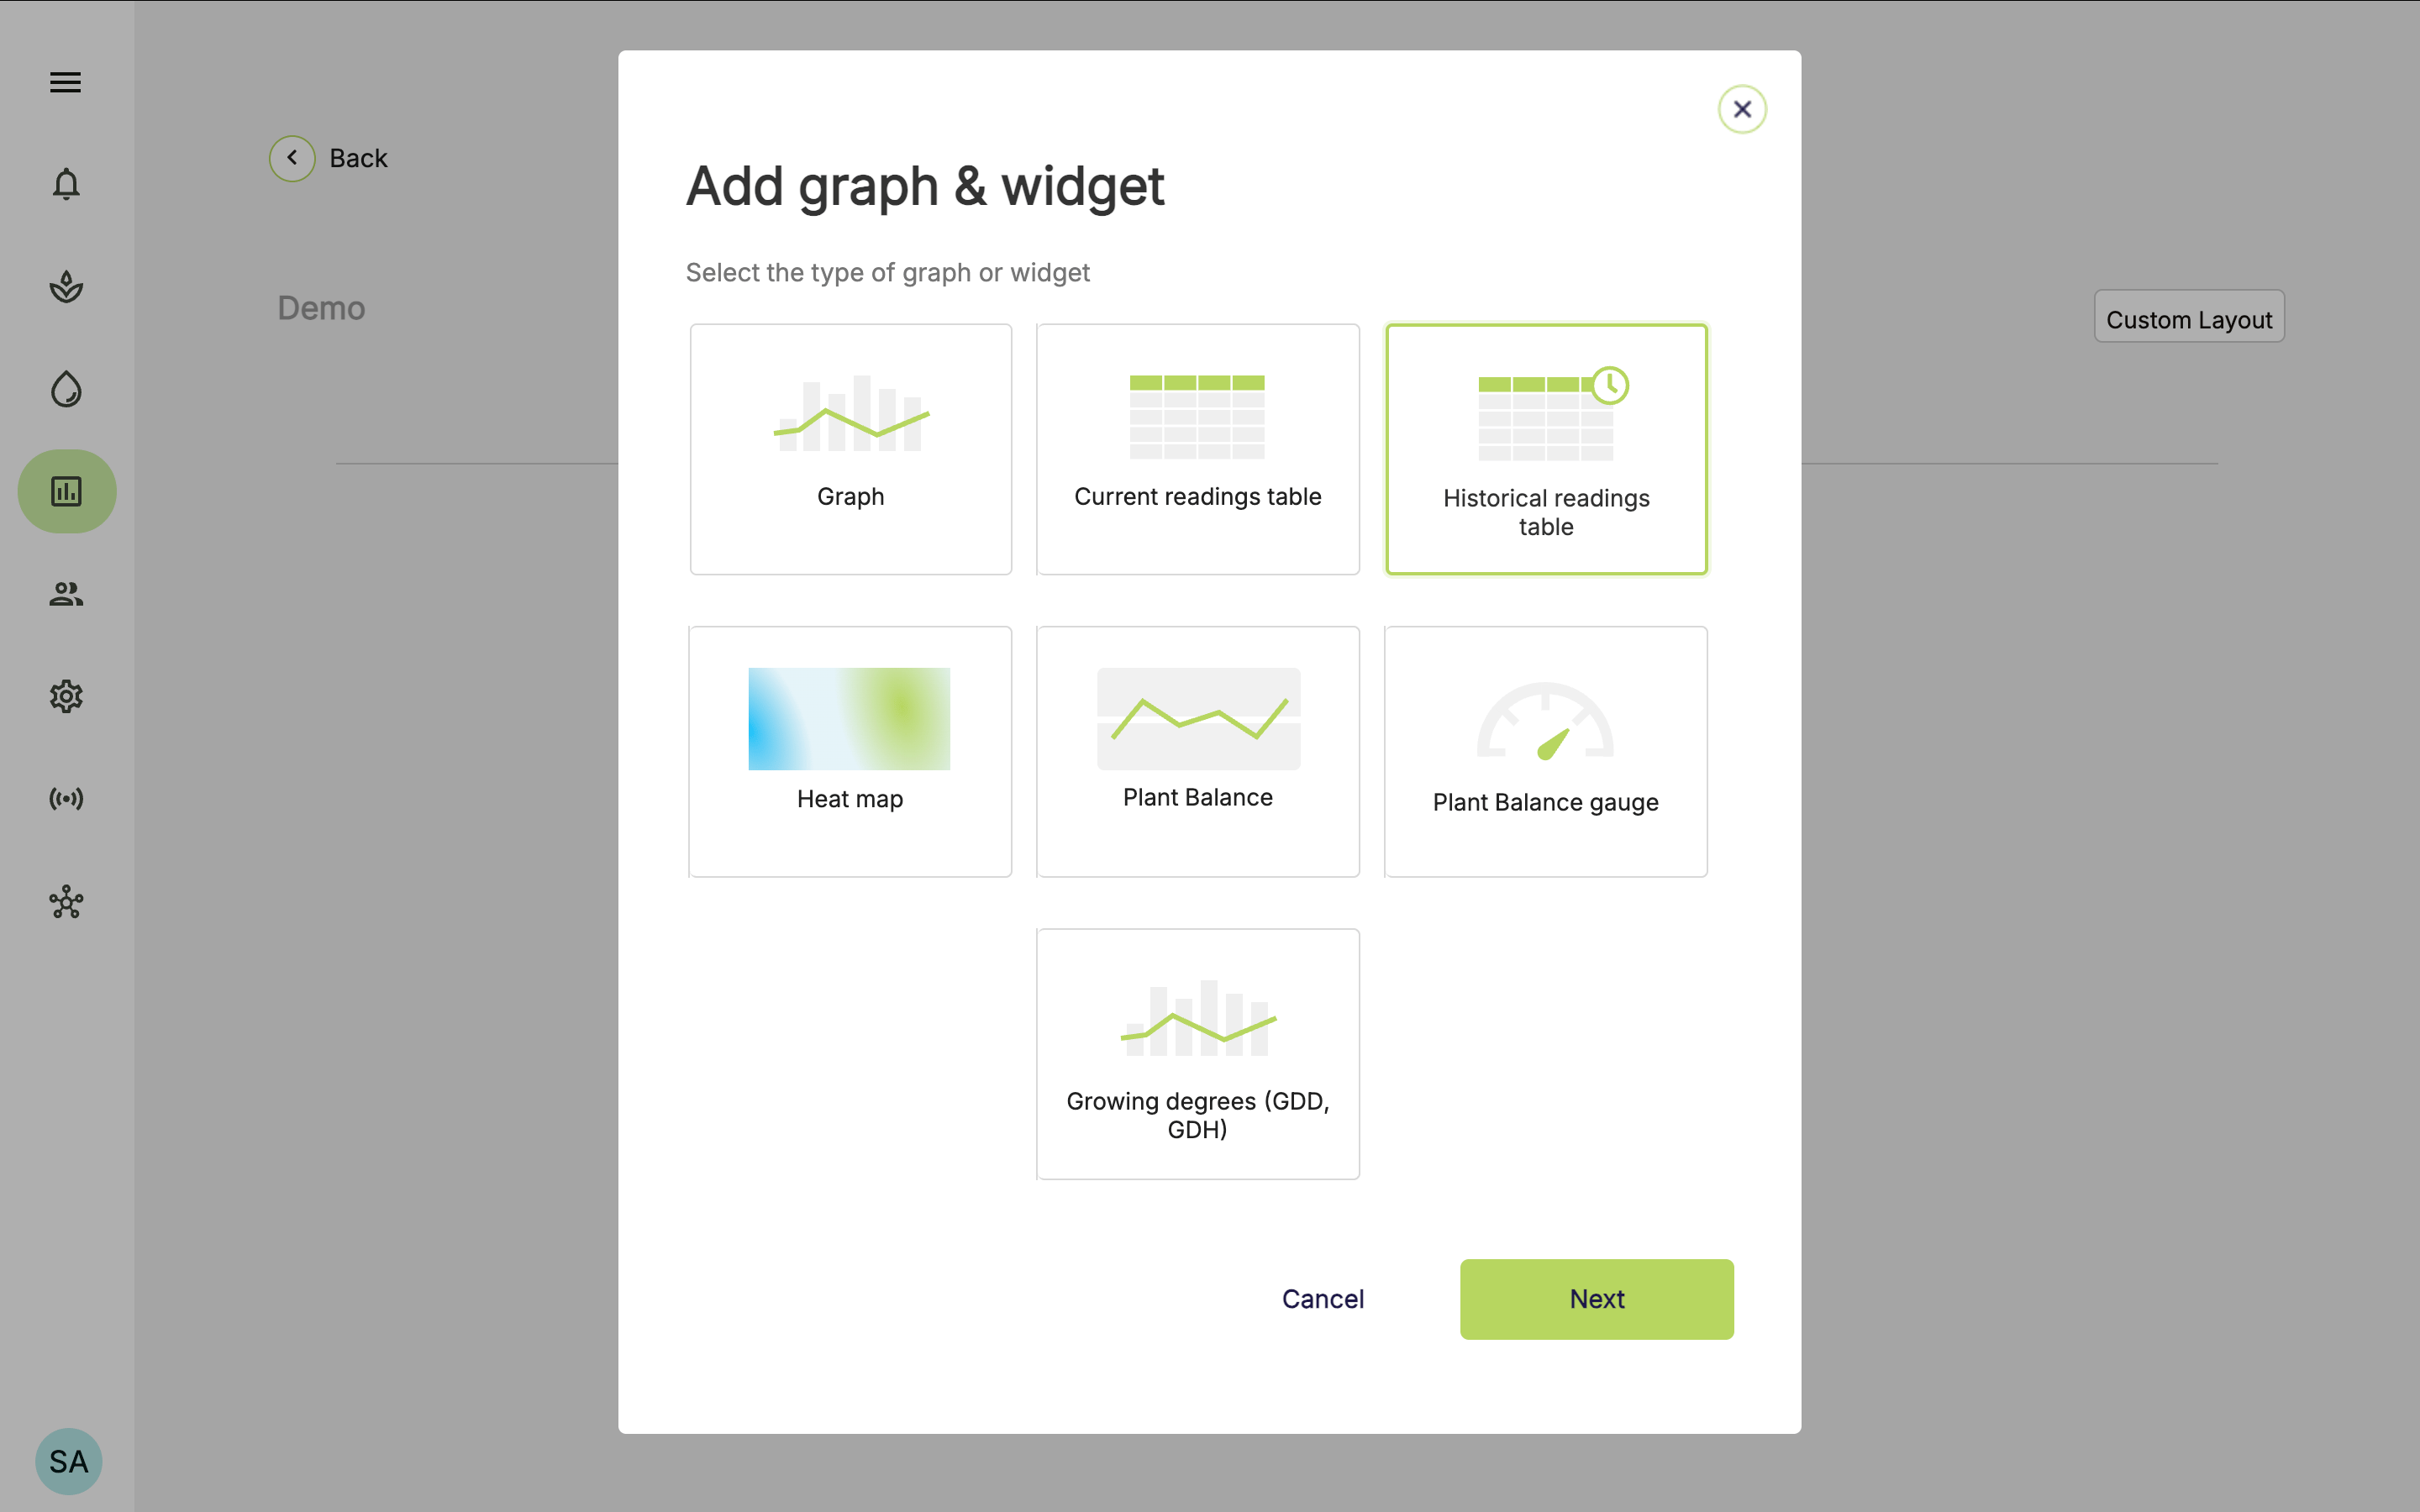
- You will then be asked to give the table a name.
You can add any number of tables to a single dashboard.
Adding sensors to a Historical readings table
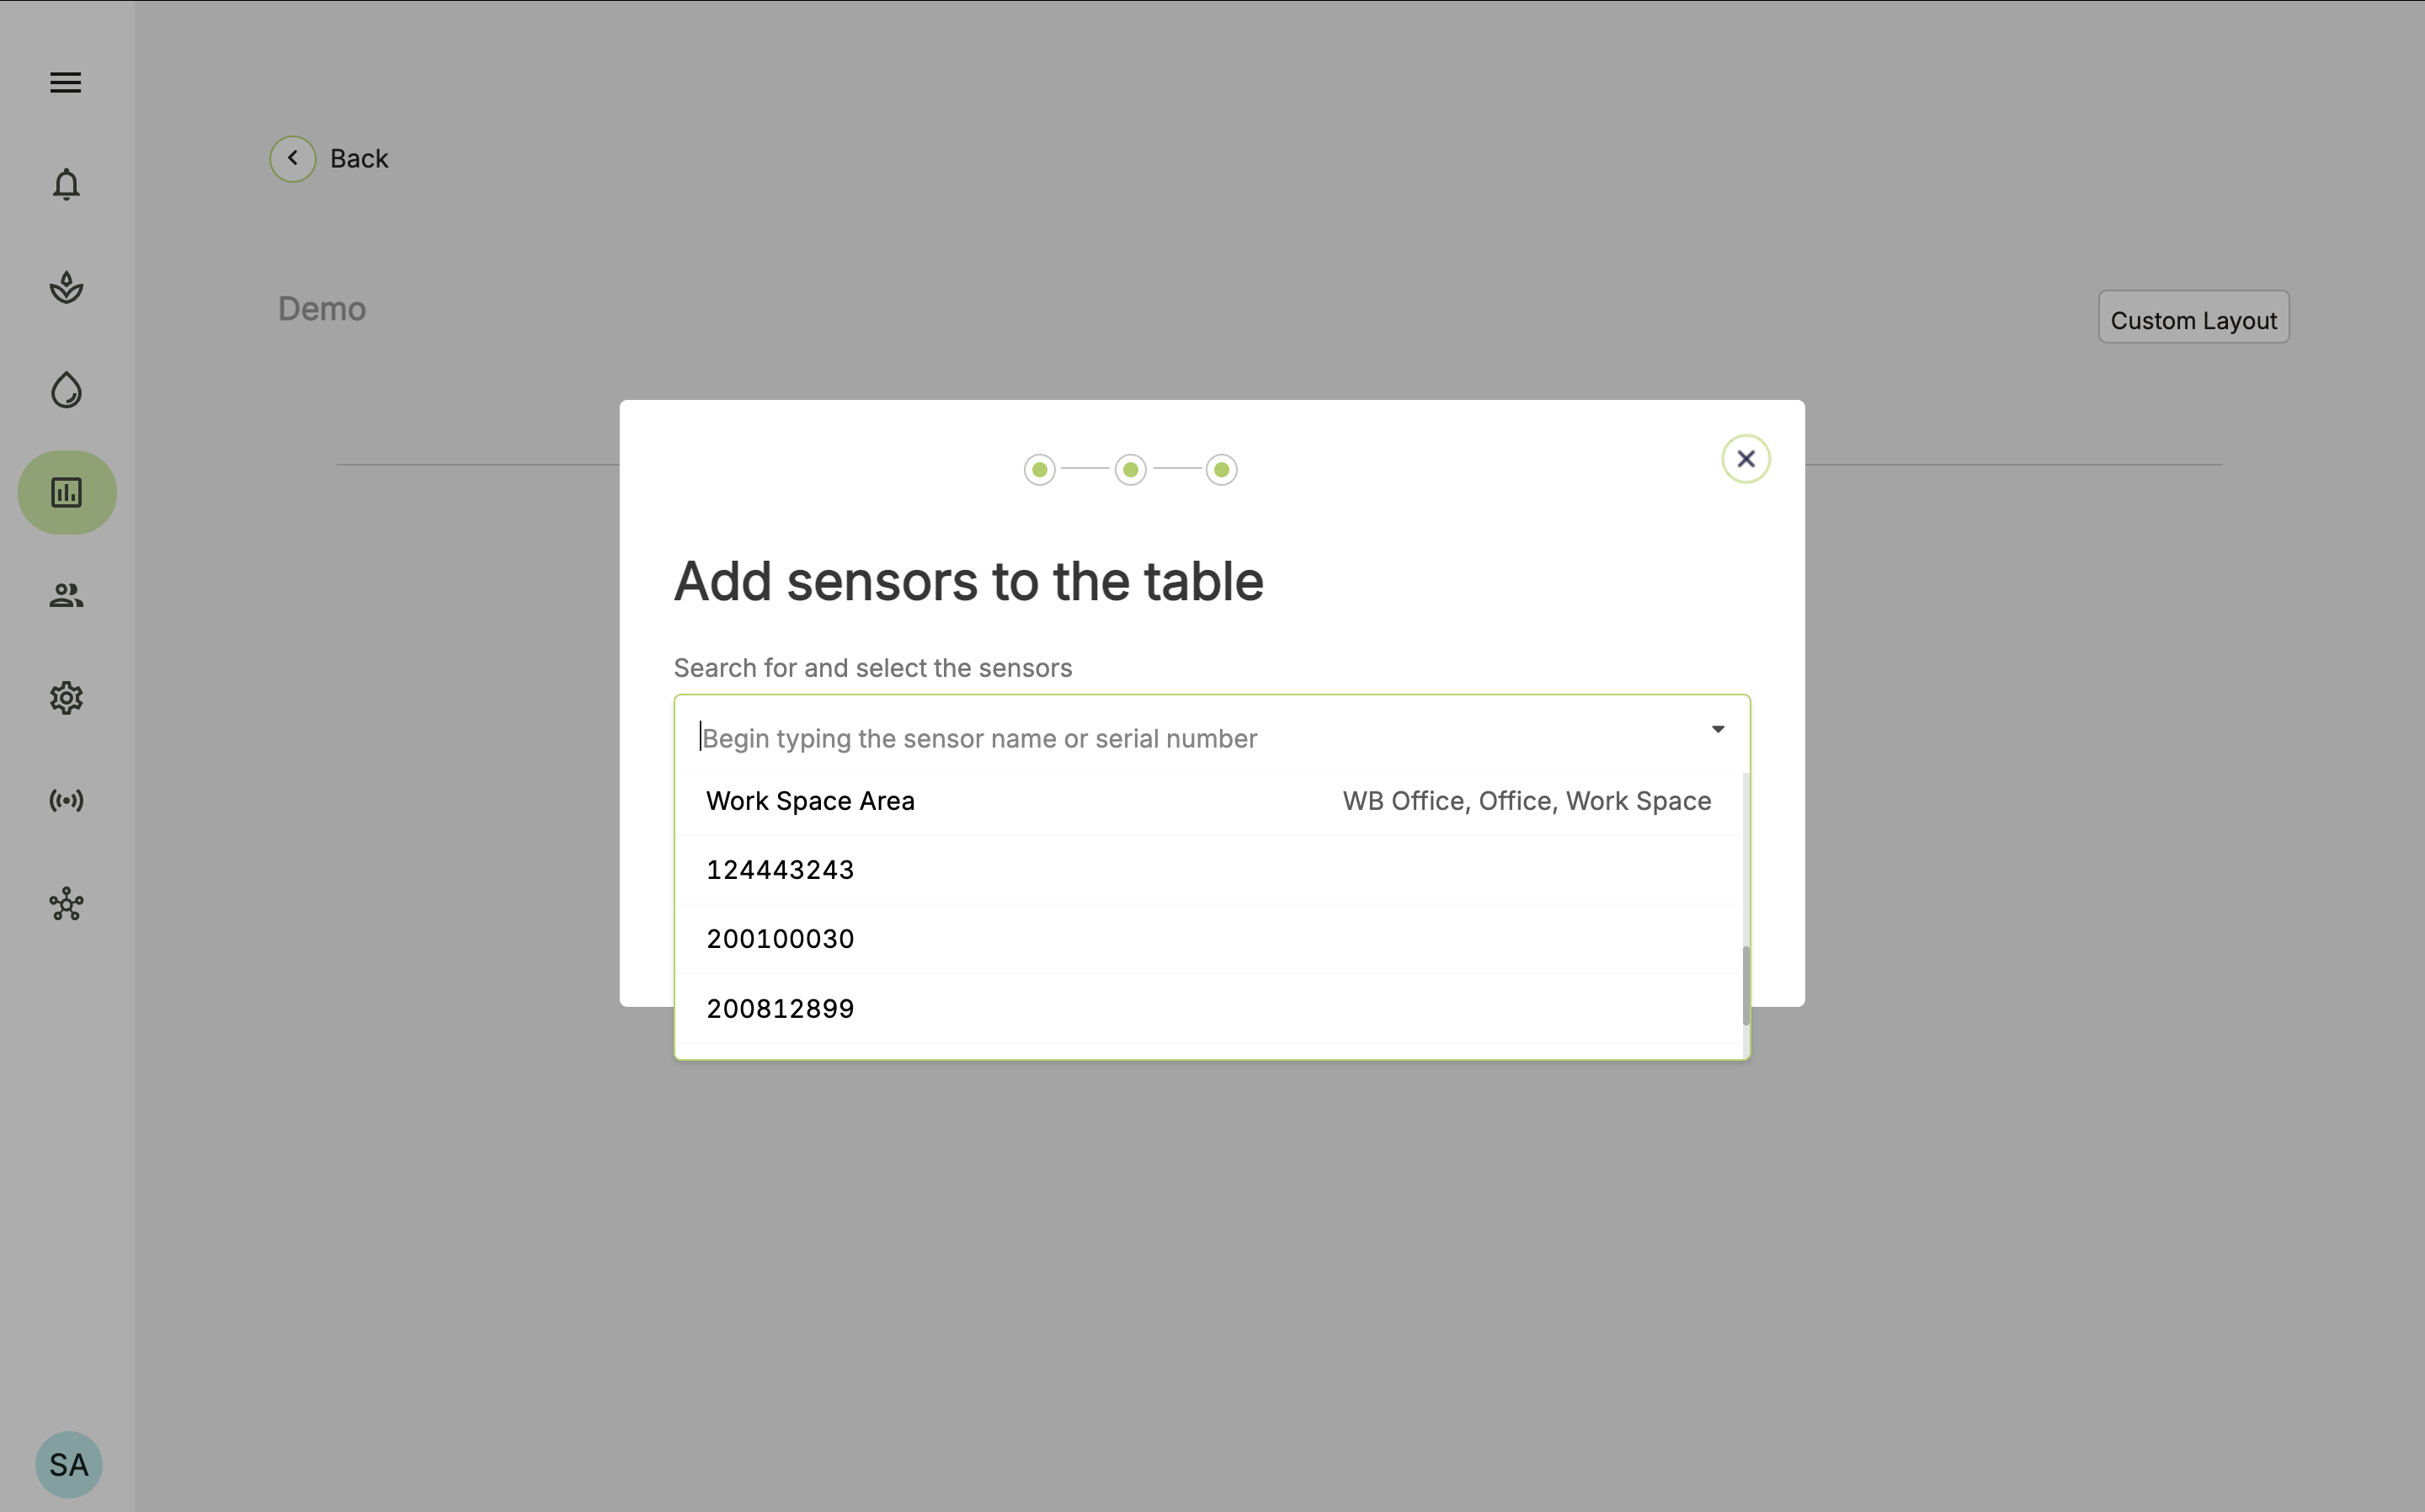
- Select the sensors you want to include in the table.
- Search for the sensor name or select it from the drop-down list.
- Choose as many sensors as you want.
- Select Done.
Set a historical time range
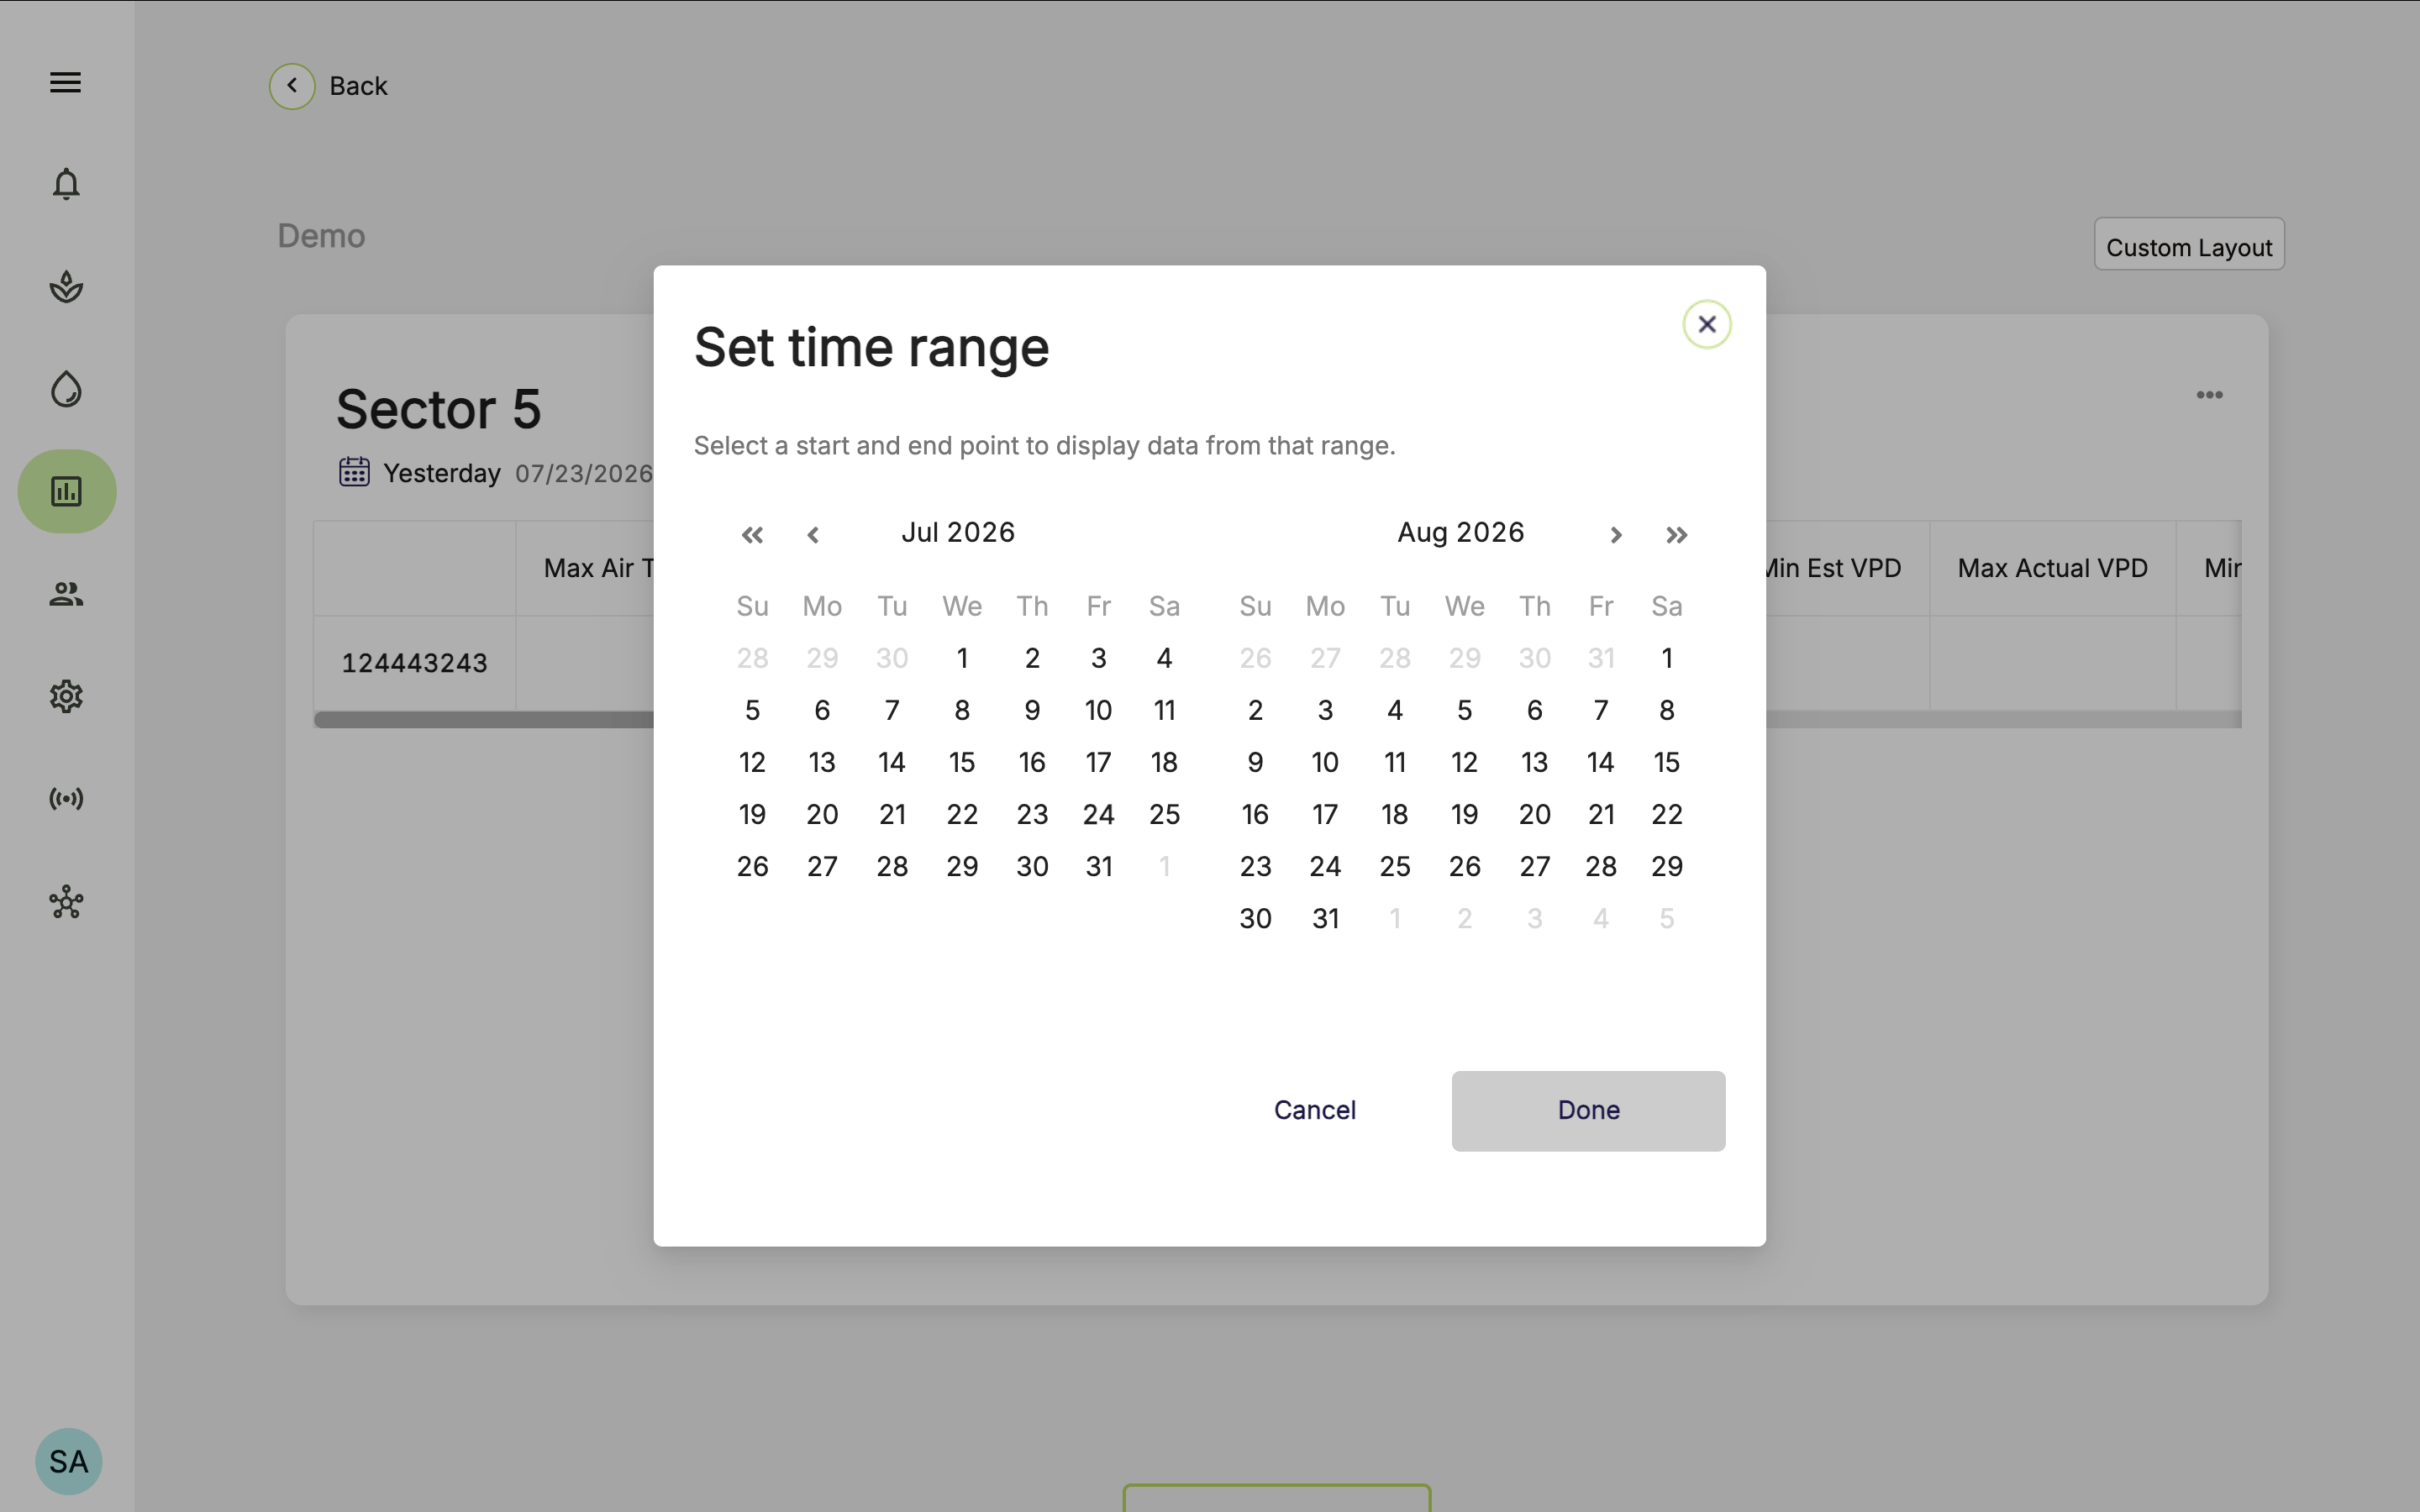
- Select the calendar icon.
- Select a date range.
- Select Done.
What readings are available in a historical readings table?
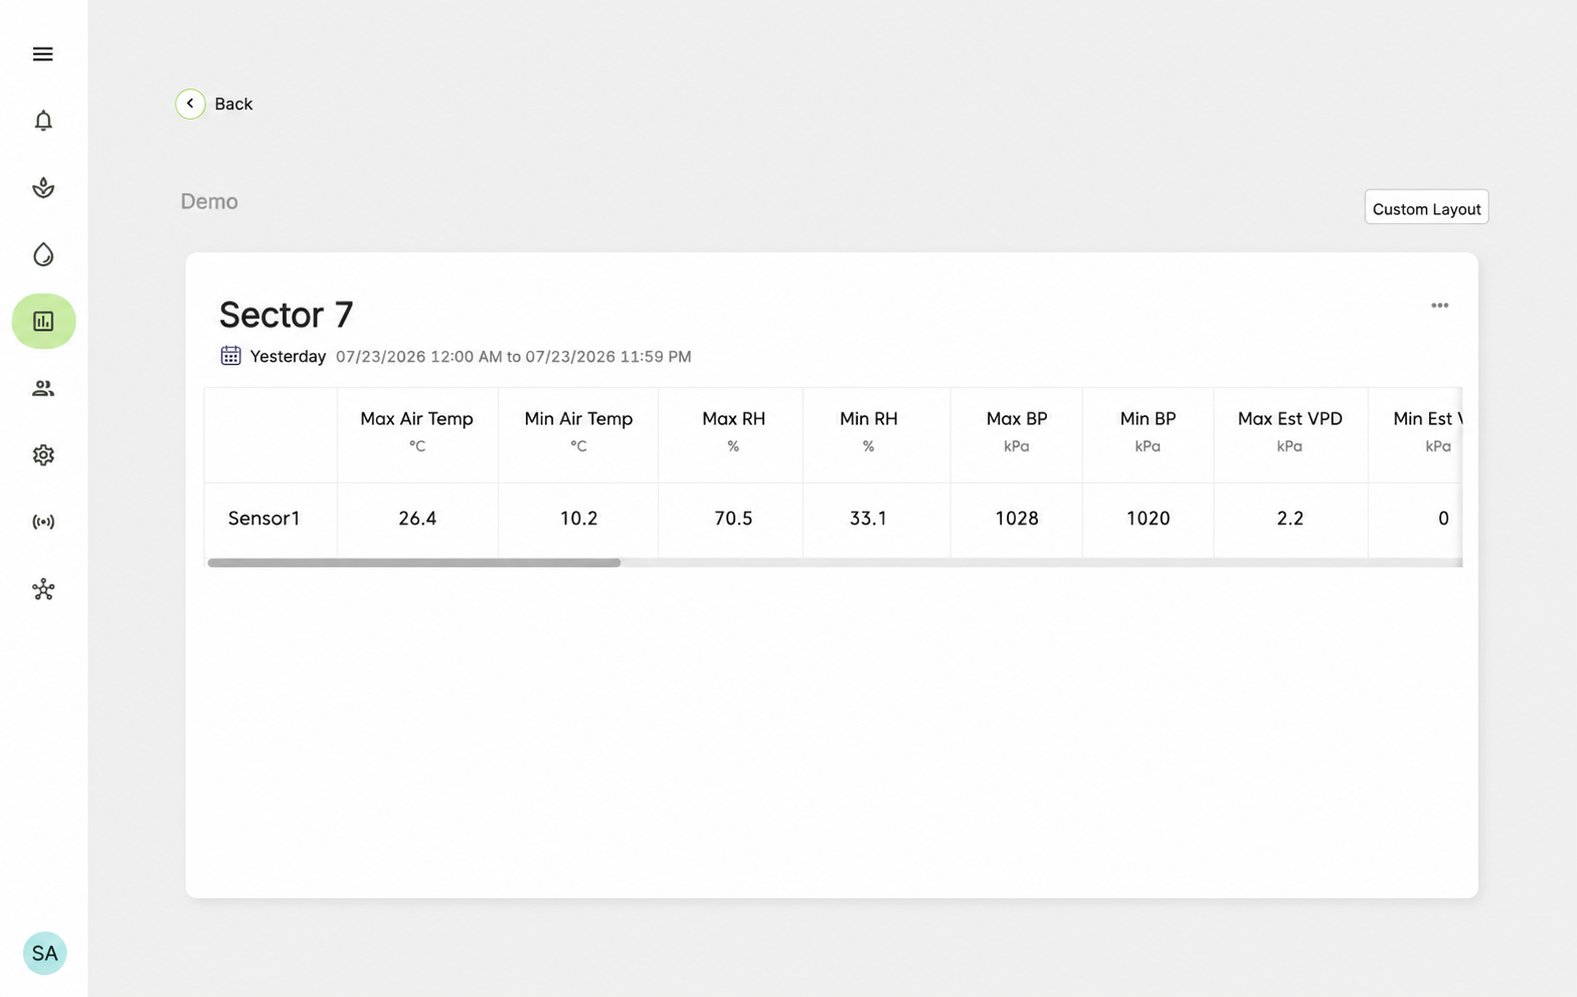
The historical readings table shows minimum and maximum readings for several sensor measurements. It also shows calculated readings such as Accumulated Solar Radiation and DLI (Daily Light Integral). If your sensors have not reported data during the selected time range, the table will show no readings. If your sensors are reporting, the table can show the following readings:- Air Temperature (Min/Max)
- Relative Humidity (Min/Max)
- Barometric Pressure (Min/Max)
- Plant Temperature (Min/Max)
- Estimated VPD (Min/Max)
- Actual VPD (Min/Max)
- Dew Point (Min/Max)
- Moisture (Min/Max)
- Average CO2
- Accumulated Solar Radiation
- Accumulated PAR
- Daily Light Integral