> ## Documentation Index
> Fetch the complete documentation index at: https://waybeyond.mintlify.site/llms.txt
> Use this file to discover all available pages before exploring further.
# How can I view Growing Degree Days/Hours (GDD, GDH) in FarmRoad?
Growing degrees can help you gain a more accurate understanding of the development of your crops than relying on time alone
FarmRoad can automatically calculate growing degree days (GDD) and growing degree hours (GDH) for a given sector or sensor.
1. Go to **Data Studio**.
2. Open the dashboard you want to use, or create a new one.
3. Scroll to the bottom of the page and click **Add graph or widget**.
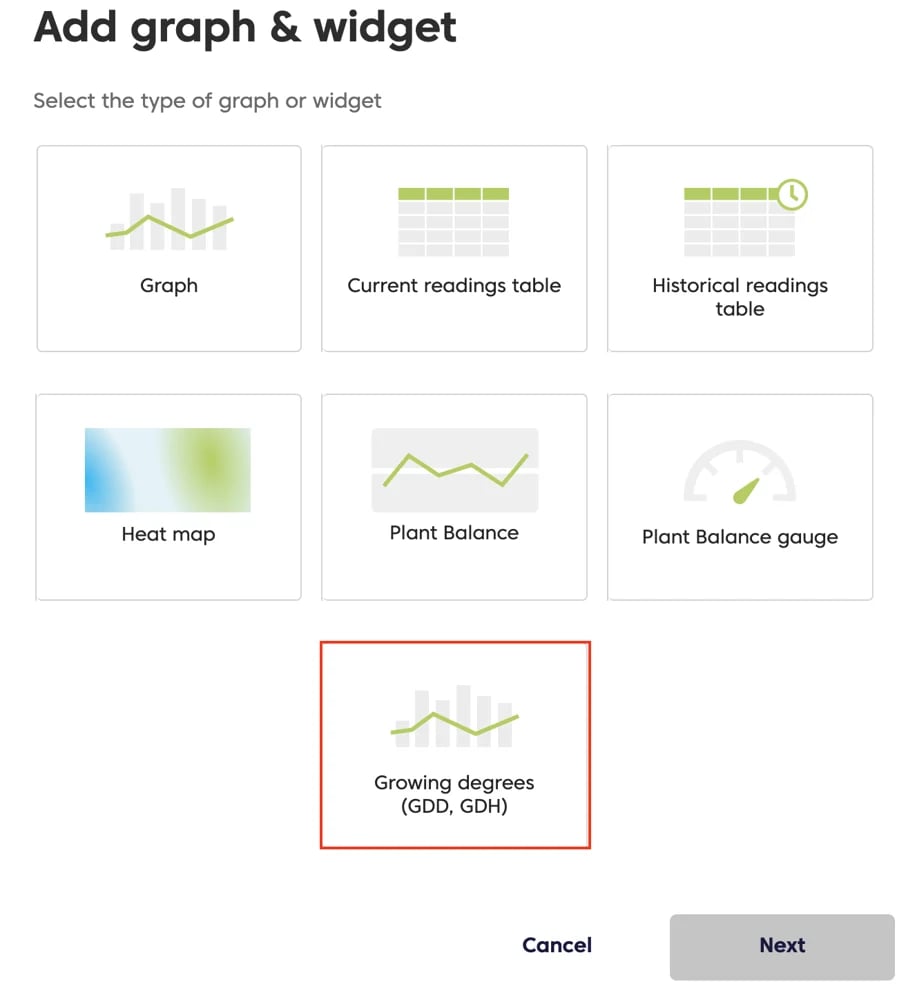
 4. Select **Growing degrees (GDD, GDH)**.
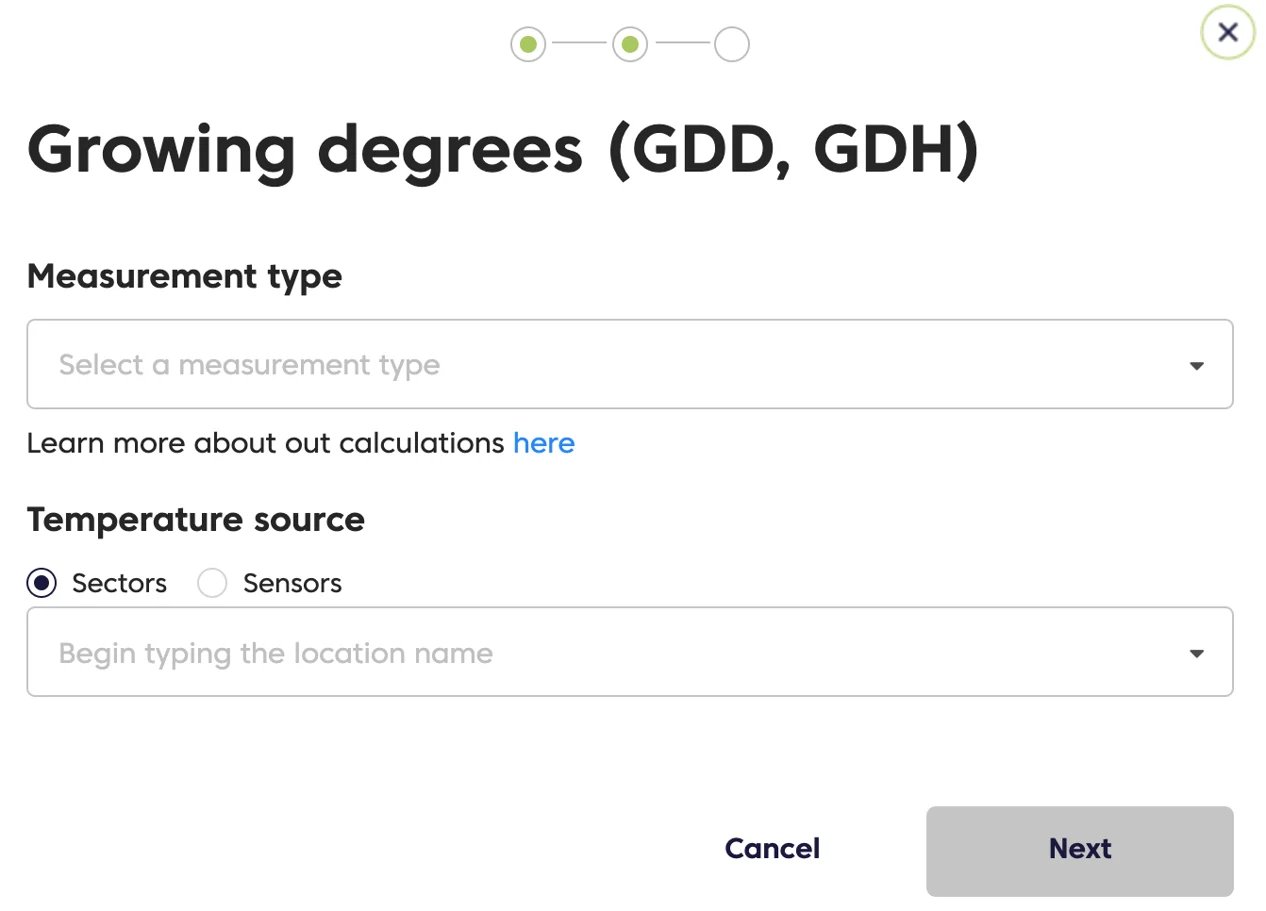
 5. Choose the calculation method you want to use (read about the differences [here](https://waybeyond.mintlify.site/en/farmroad/understanding-growing-degree-calculation-types)), and select the relevant sector or sensor.
 6. Specify a base temperature for the calculation, as well as an optional maximum temperature (above which additional growing degrees are not accumulated), plus a start date.
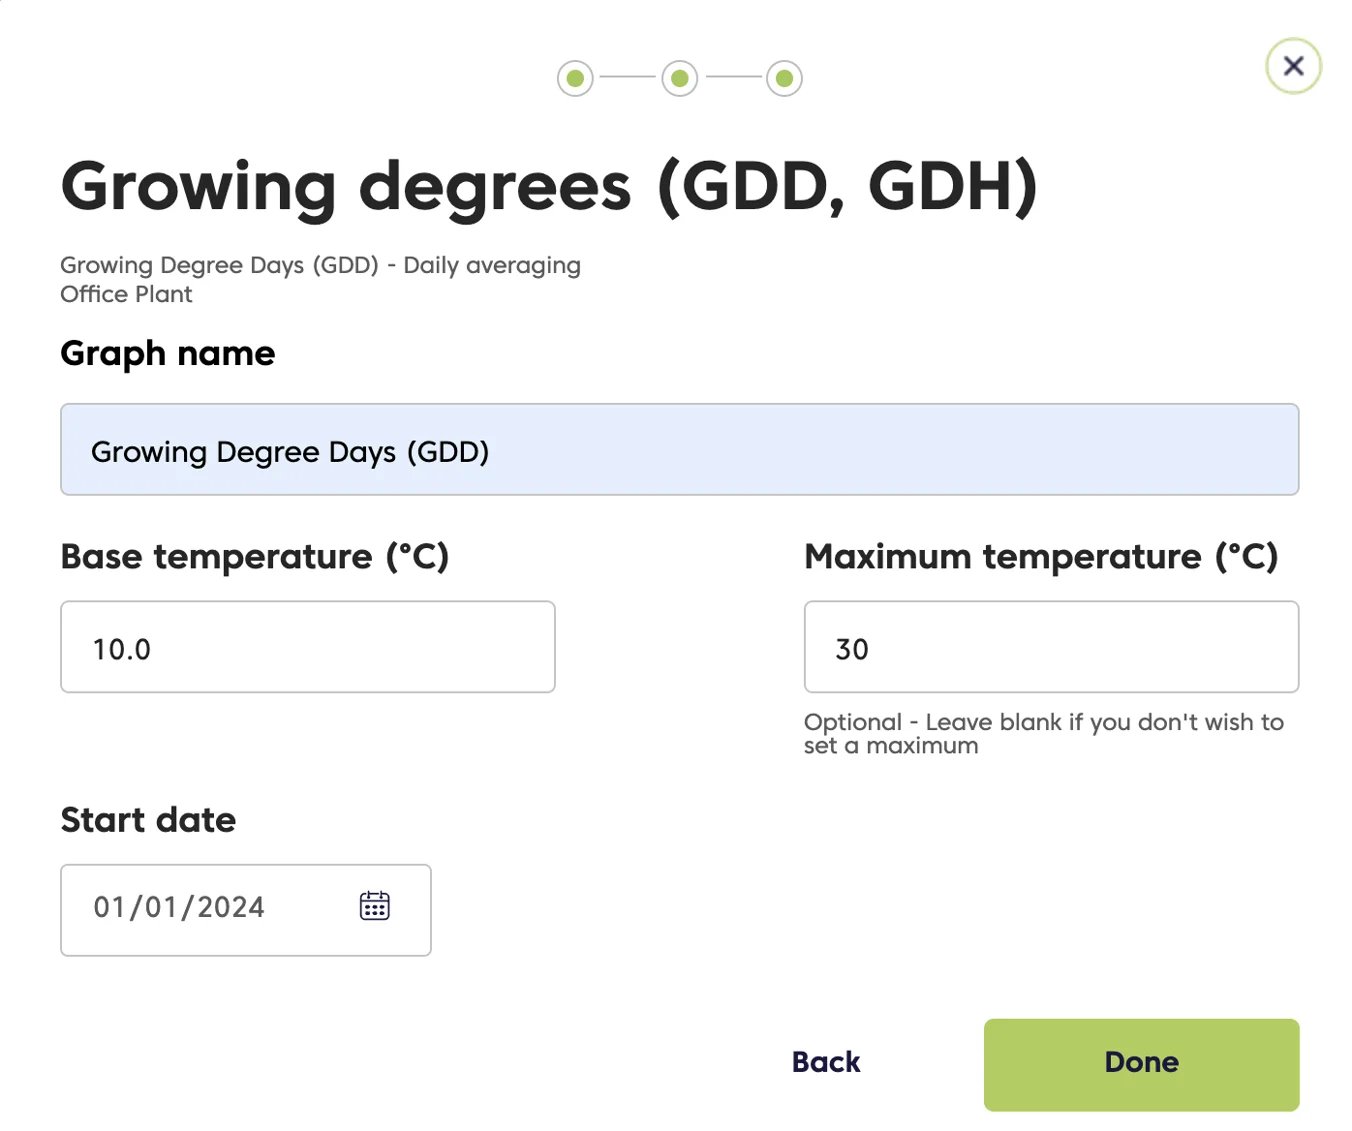 7. Click **Done**.
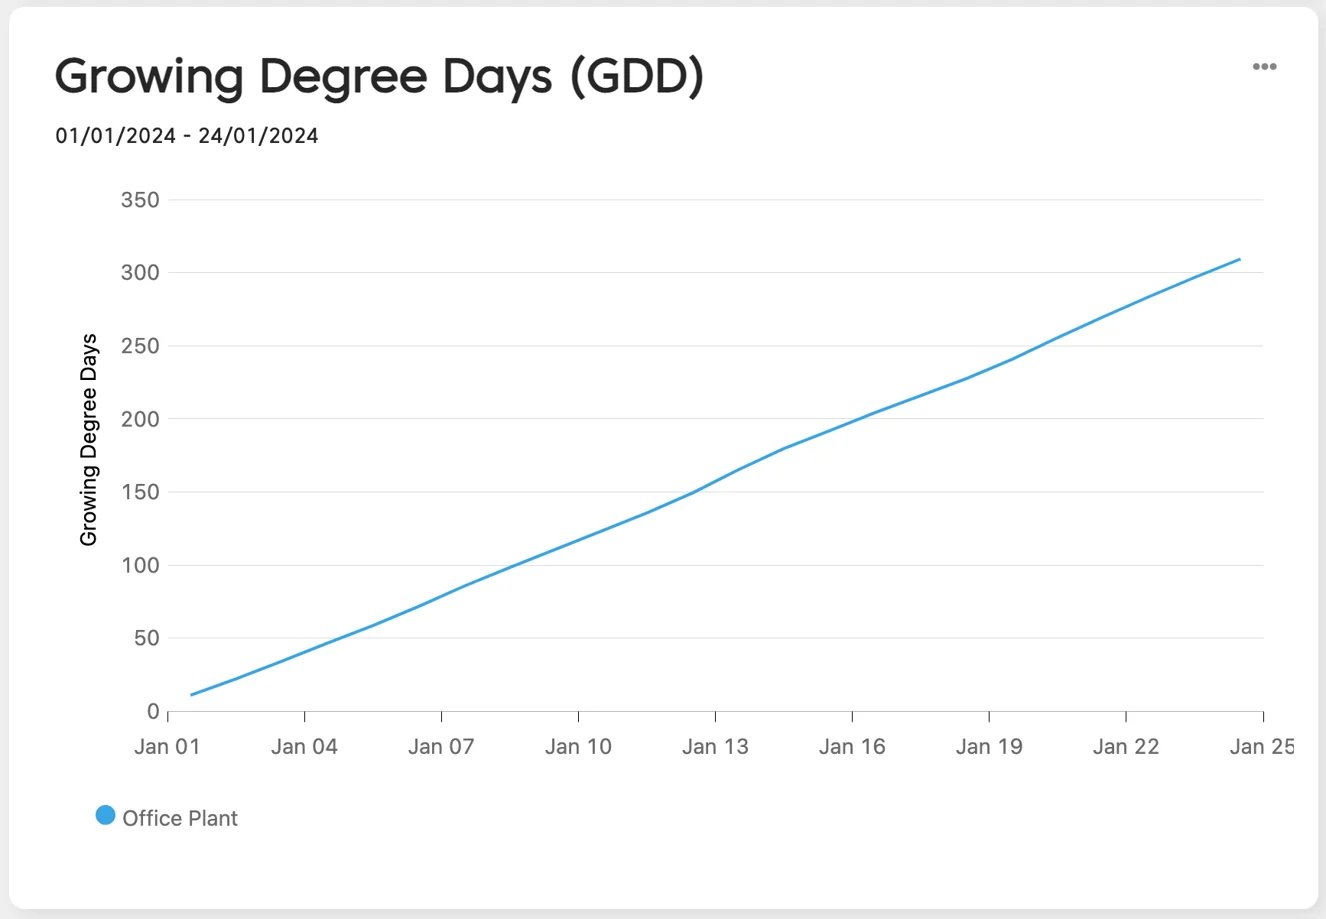
Your dashboard will reload and display the new Growing Degrees graph.
7. Click **Done**.
Your dashboard will reload and display the new Growing Degrees graph.